

Observe
Telemetry
Charts for an organisation, a proxy, a credential, or an MCP server.
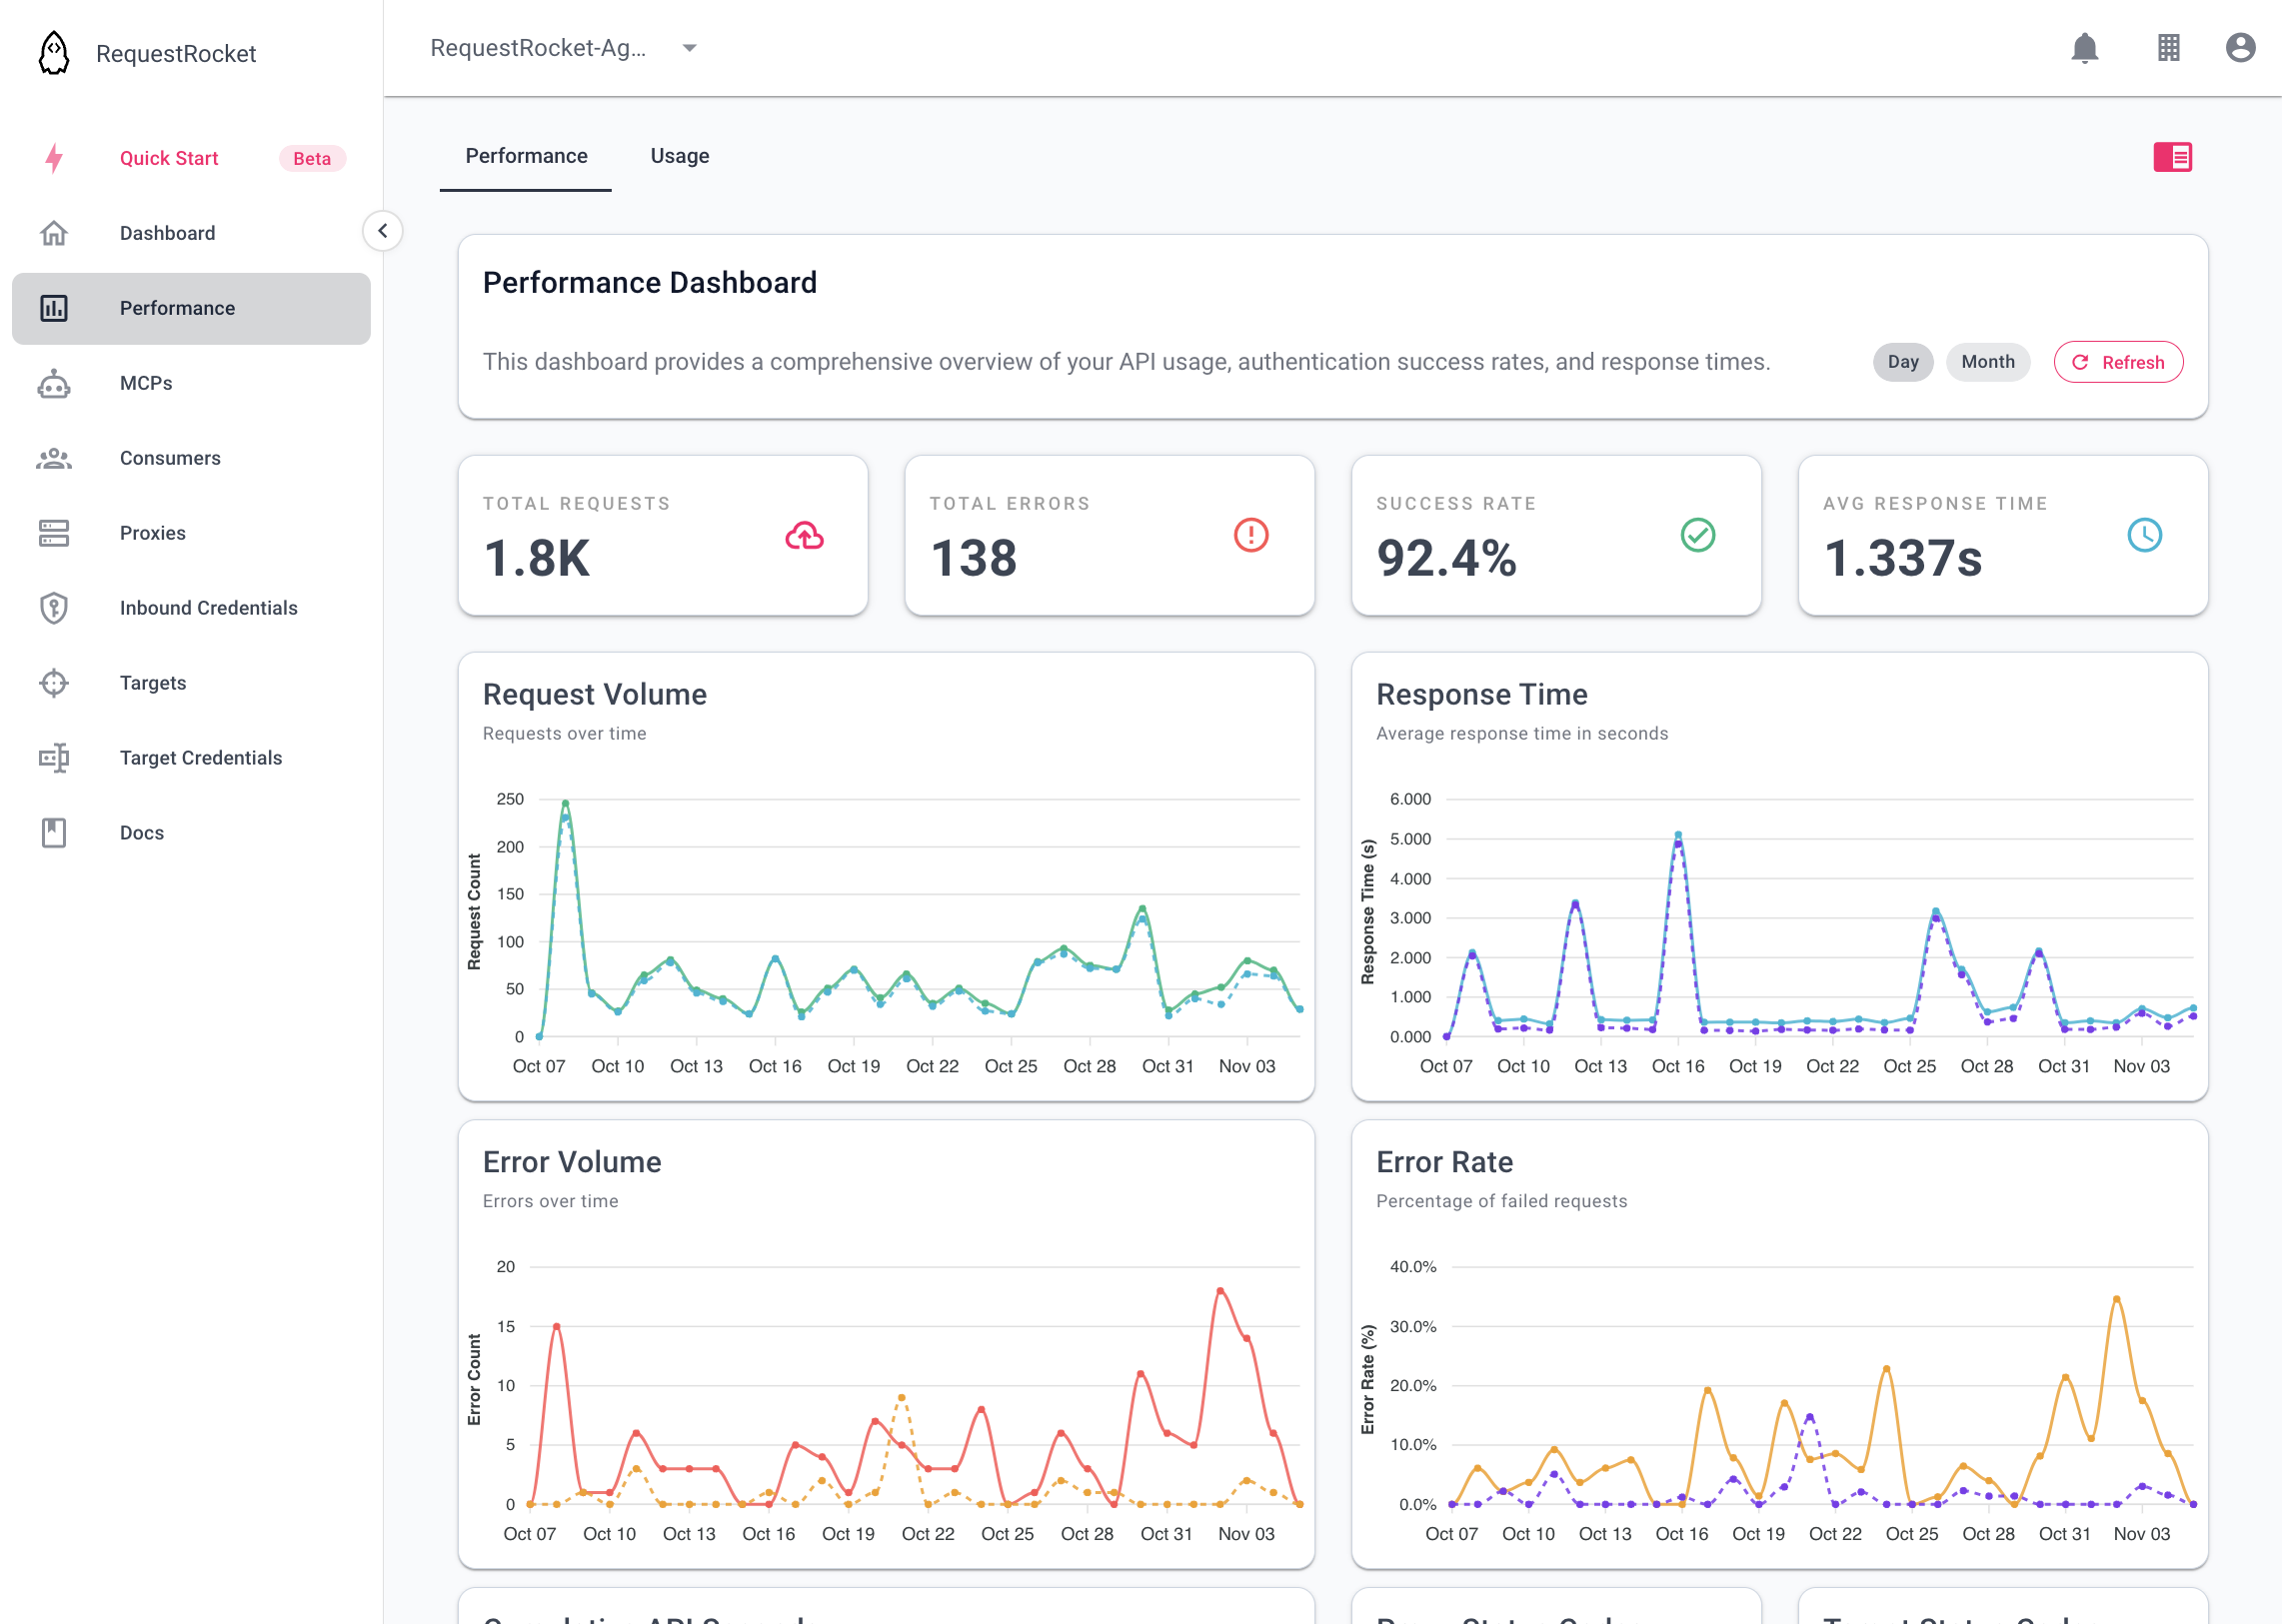
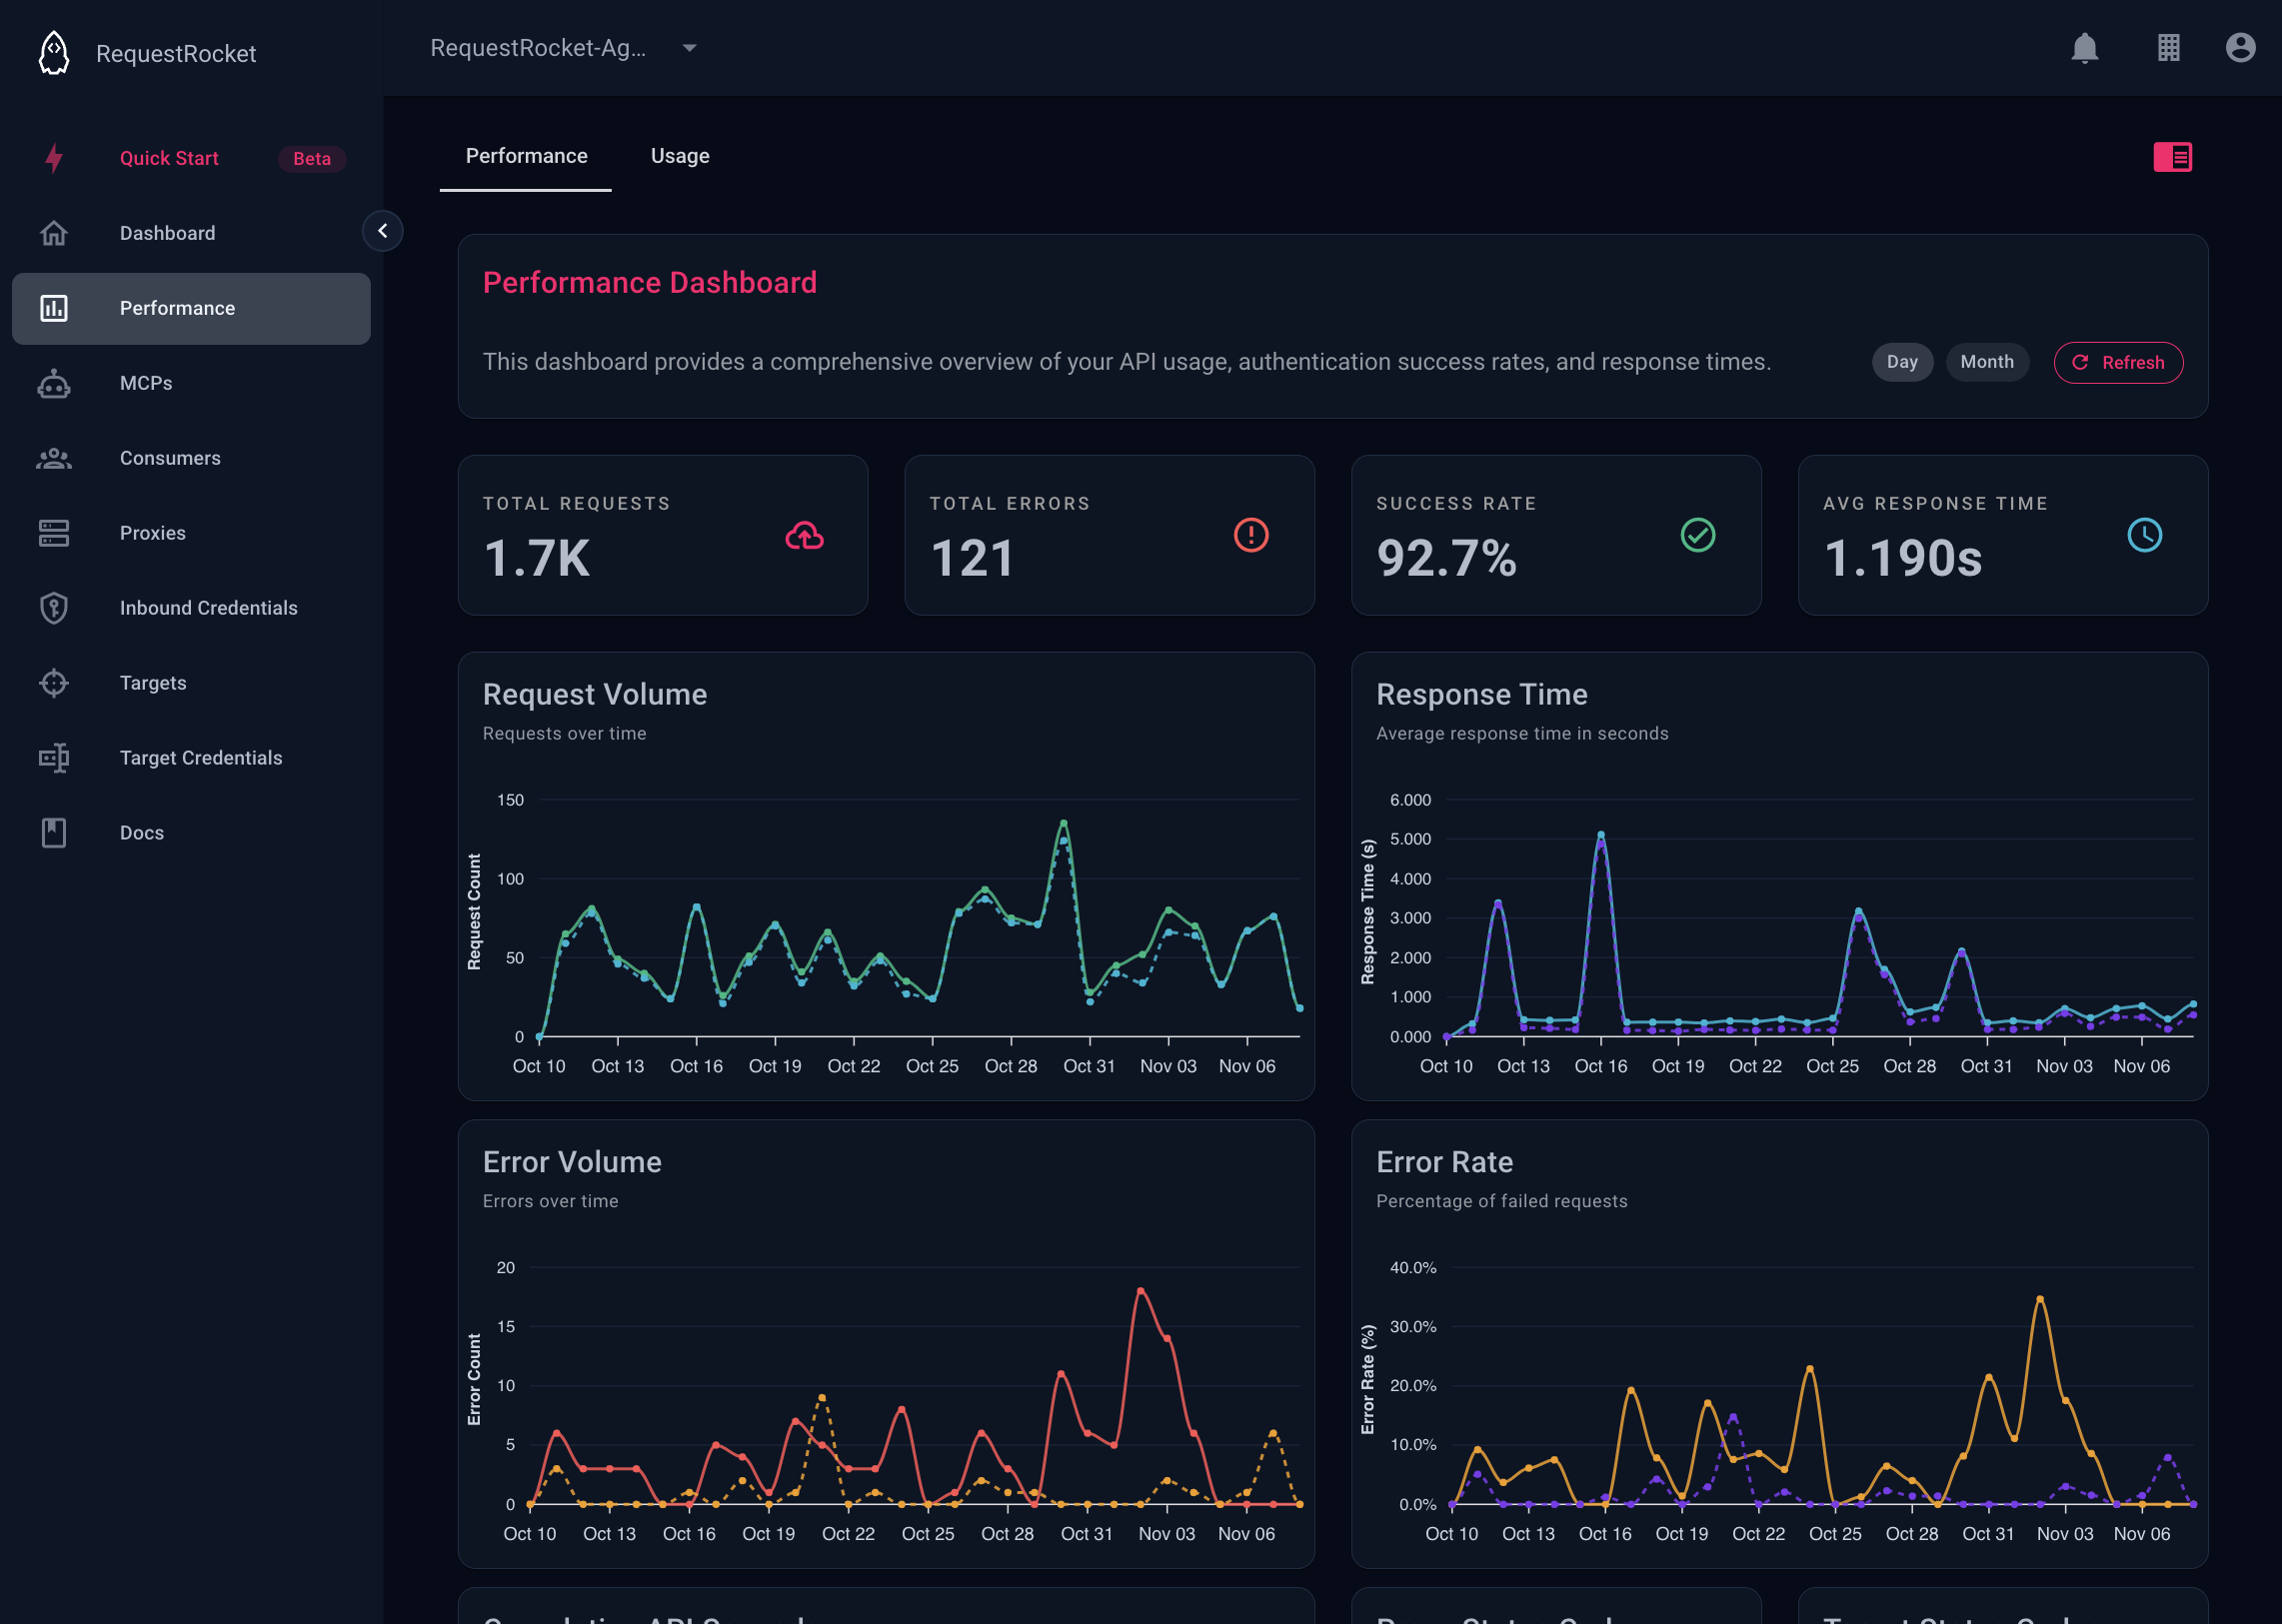
Telemetry is the time series for calls. Before you start, make at least one call through a proxy so the selected interval has data.
| View | Where to open it |
|---|---|
| Organisation performance | Performance, Performance tab |
| Organisation meter usage | Performance, Usage tab |
| One proxy | Open a saved proxy and use its General or Observe view |
Credential and direct MCP telemetry are available through the registered tools and Core API routes. MSP client telemetry is on Managed clients.
Result
The page shows aggregated buckets for the selected organisation and interval. Use Request logs when you need the individual calls behind a bucket.
Troubleshooting
- An empty range can mean no calls were processed in those buckets.
- Valid intervals are minute, hour, day, and month.
- Use a proxy's own view when organisation totals are too broad for diagnosis.